Ιστογράμματα με το Octave/Matlab
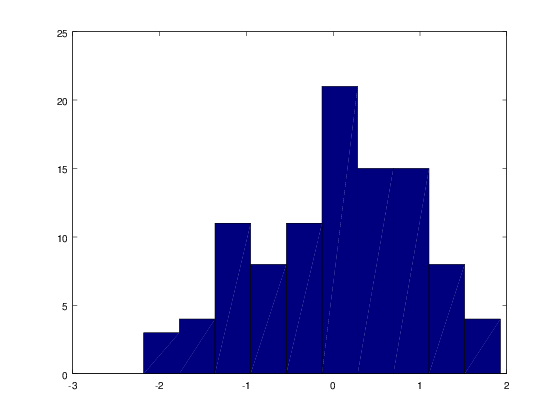
Απλό ιστόγραμμα

clear; cla; clf;

randn('seed', 1);
x = randn(100, 1);

hist(x);

print -depsc2 -r300 plotHist1.eps
print -dpng   -r72  plotHist1.png
Κατασκευή ιστογράμματος ως ραβδόγραμμα
clear; cla; clf;

randn('seed', 1);
x = randn(100, 1);

[counts, centers] = hist(x);

bar(centers, counts, 1);

print -depsc2 -r300 plotHist1a.eps
print -dpng   -r72  plotHist1a.png
Ιστόγραμμα με δύο σειρές δεδομένων
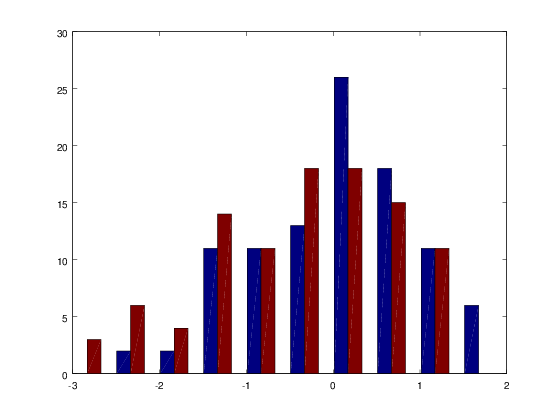
randn('seed', 1);
x = randn(100, 2);

hist(x);
Μορφοποίηση ιστογράμματος
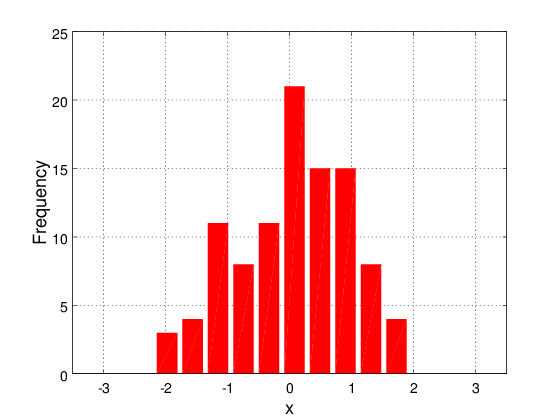
clear; cla; clf;

randn('seed', 1);
x = randn(100, 1);

hist(x, 'FaceColor', 'r', 'EdgeColor', 'none');
grid on;
axis([-3.5 3.5 0 25]);
xlabel('x', 'FontWeight', 'bold', 'FontSize', 18);
ylabel('Frequency',  'FontWeight', 'bold', 'FontSize', 18);
set(gca, 'FontSize', 14);

print -depsc2 -r300 plotHist2.eps
print -dpng   -r72  plotHist2.png
Πλήθος διαστημάτων διαμέρισης
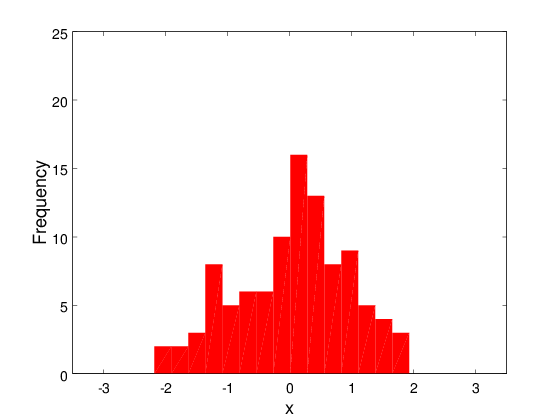
clear; cla; clf;

randn('seed', 1);
x = randn(100, 1);

hist(x, 15, 'BarWidth', 1, 'FaceColor', 'r', 'EdgeColor', 'none');
axis([-3.5 3.5 0 25]);
xlabel('x', 'FontWeight', 'bold', 'FontSize', 18);
ylabel('Frequency',  'FontWeight', 'bold', 'FontSize', 18);
set(gca, 'FontSize', 14);

print -depsc2 -r300 plotHist3.eps
print -dpng   -r72  plotHist3.png
Ορισμός διαστημάτων διαμέρισης
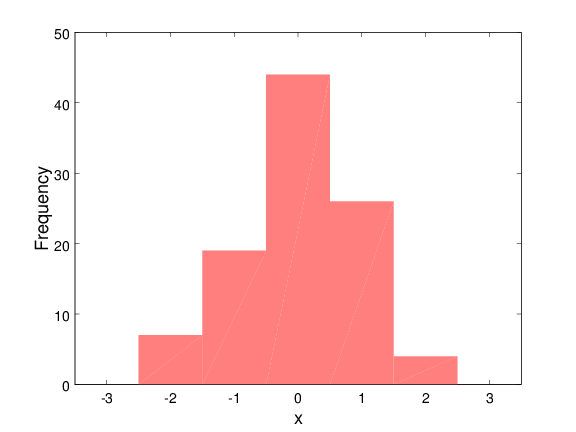
clear; cla; clf;

randn('seed', 1);
x    = randn(100, 1);
bins = -3:1:3;

hist(x, bins, 'BarWidth', 1, 'FaceColor', [1 0.5 0.5], 'EdgeColor', 'none');
axis([-3.5 3.5]);
xlabel('x', 'FontWeight', 'bold', 'FontSize', 18);
ylabel('Frequency',  'FontWeight', 'bold', 'FontSize', 18);
set(gca, 'FontSize', 14);
set(gca, 'xtick', [-3:1:3]);

print -depsc2 -r300 plotHist4.eps
print -dpng   -r72  plotHist4.png
Λεπτότερη διαμέριση
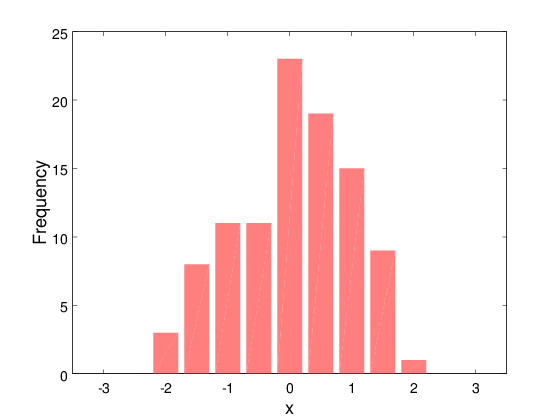
clear; cla; clf;

randn('seed', 1);
x    = randn(100, 1);
bins = -3:0.5:3;

hist(x, bins, 'FaceColor', [1 0.5 0.5], 'EdgeColor', 'none');
axis([-3.5 3.5]);
xlabel('x', 'FontWeight', 'bold', 'FontSize', 18);
ylabel('Frequency',  'FontWeight', 'bold', 'FontSize', 18);
set(gca, 'FontSize', 14);
set(gca, 'xtick', [-3:1:3]);

print -depsc2 -r300 plotHist5.eps
print -dpng   -r72  plotHist5.png
Αλλαγή ορίων στα διαστήματα διαμέρισης
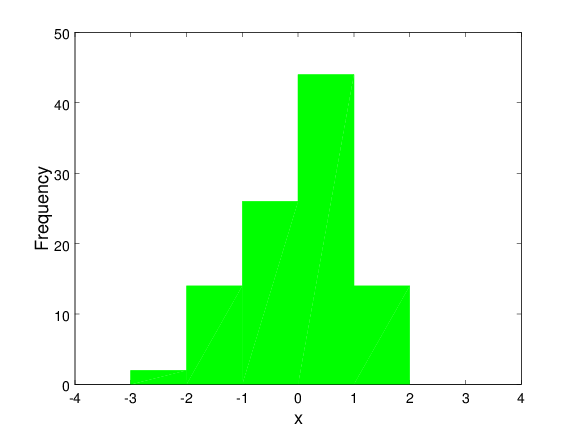
clear; cla; clf;

randn('seed', 1);
x    = randn(100, 1);
bins = -3.5:1:3.5;

hist(x, bins, 'BarWidth', 1, 'FaceColor', 'g','EdgeColor', 'g');
axis([-4 4]);
xlabel('x', 'FontWeight', 'bold', 'FontSize', 18);
ylabel('Frequency',  'FontWeight', 'bold', 'FontSize', 18);
set(gca, 'FontSize', 14);
set(gca, 'xtick', [-4:1:4]);

print -depsc2 -r300 plotHist6.eps;
print -dpng   -r72  plotHist6.png;
Επίδειξη των διαφορικών διαστημάτων διαμέρισης στο ίδιο γράφημα
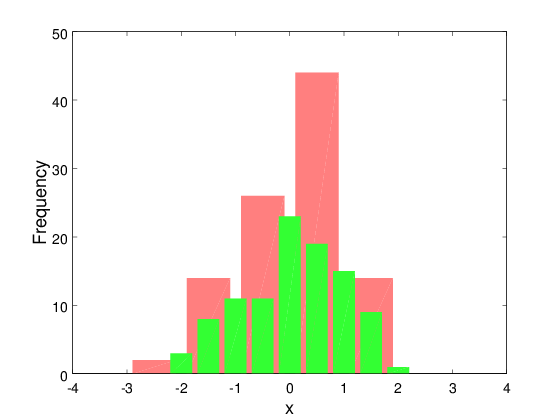
clear; cla; clf;

randn('seed', 1);
x     = randn(100, 1);
bins1 = -3.5:1.0:3.5;
bins5 = -3.5:0.5:3.5;

hist(x, bins1, 'FaceColor', [1 0.5 0.5], 'EdgeColor', 'none');
axis([-4 4]);
xlabel('x', 'FontWeight', 'bold', 'FontSize', 18);
ylabel('Frequency',  'FontWeight', 'bold', 'FontSize', 18);
set(gca, 'FontSize', 14);
set(gca, 'xtick', [-4:1:4]);
hold on;

hist(x, bins5, 'FaceColor', [0.2 1 0.2], 'EdgeColor', 'none');
hold off;

print -depsc2 -r300 plotHist7.eps
print -dpng   -r72  plotHist7.png
Ραβδόγραμμα συχνοτήτων και πολύγωνο συχνοτήτων στο ίδιο γράφημα
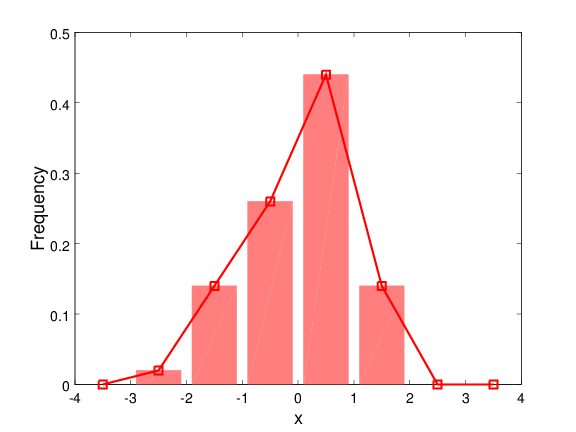
clear; cla; clf;

randn('seed', 1);
x    = randn(100, 1);
bins = -3.5:1:3.5;

hist(x, bins, 1, 'FaceColor', [1 0.5 0.5], 'EdgeColor', [1 0.5 0.5]);
axis([-4 4 0 0.5]);
xlabel('x', 'FontWeight', 'bold', 'FontSize', 18);
ylabel('Frequency',  'FontWeight', 'bold', 'FontSize', 18);
set(gca, 'FontSize', 14);
set(gca, 'xtick', [-4:1:4]);
hold on;

[dens, centers] = hist(x, bins, 1);
plot(centers, dens, '-sr', 'MarkerSize', 8, 'LineWidth', 2);
hold off;

print -depsc2 -r300 plotHist8.eps
print -dpng   -r72  plotHist8.png
Ιστόγραμμα και θεωρητική καμπύλης της κατανομής
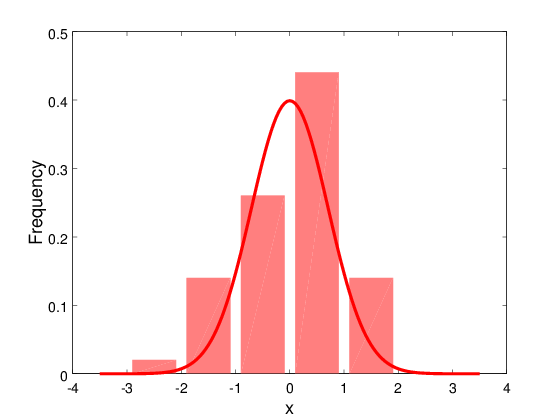
clear; cla; clf;

randn('seed', 1);
x    = randn(100, 1);
bins = -3.5:1:3.5;

hist(x, bins, 1, 'FaceColor', [1 0.5 0.5], 'EdgeColor', [1 0.5 0.5]);
axis([-4 4 0 0.5]);
xlabel('x', 'FontWeight', 'bold', 'FontSize', 18);
ylabel('Frequency',  'FontWeight', 'bold', 'FontSize', 18);
set(gca, 'FontSize', 14);
set(gca, 'xtick', [-4:1:4]);

hold on;

r = -3.5:0.05:3.5;
Y = 1/sqrt(2*pi) * exp(-r.^2);
plot(r, Y, '-r', 'LineWidth', 3);
hold off;

print -depsc2 -r300 plotHist9.eps
print -dpng   -r72  plotHist9.png
Συνδεθείτε για περισσότερες δυνατότητες αλληλεπίδρασης,
σχολιασμοί, εξωτερικοί σύνδεσμοι, βοήθεια, ψηφοφορίες, αρχεία, κτλ.
σχολιασμοί, εξωτερικοί σύνδεσμοι, βοήθεια, ψηφοφορίες, αρχεία, κτλ.

Εκπαιδευτικό υλικό από τον
Αθανάσιο Σταυρακούδη
σας παρέχετε κάτω από την άδεια
Creative Commons Attribution-NonCommercial-ShareAlike 4.0 License.
Σας παρακαλώ να ενημερωθείτε για κάποιους επιπλέον περιορισμούς
http://stavrakoudis.econ.uoi.gr/stavrakoudis/?iid=401.